This website uses cookies so that we can provide you with the best user experience possible. Cookie information is stored in your browser and performs functions such as recognising you when you return to our website and helping our team to understand which sections of the website you find most interesting and useful.
Email us at sales@brainnwave.ai
Or you can book a demo meeting straight into Simon's calendar with the link below:
Historical Sector Data, Improved Business Pages, Topics & Keywords Search and More
Estimated reading time: 2 minutes, 42 seconds.
We’re delighted to be able to announce a string of new updates to Mosaic Smart Sector Insights in line with feedback we’ve recieved as well as extensive market research.
Business Page
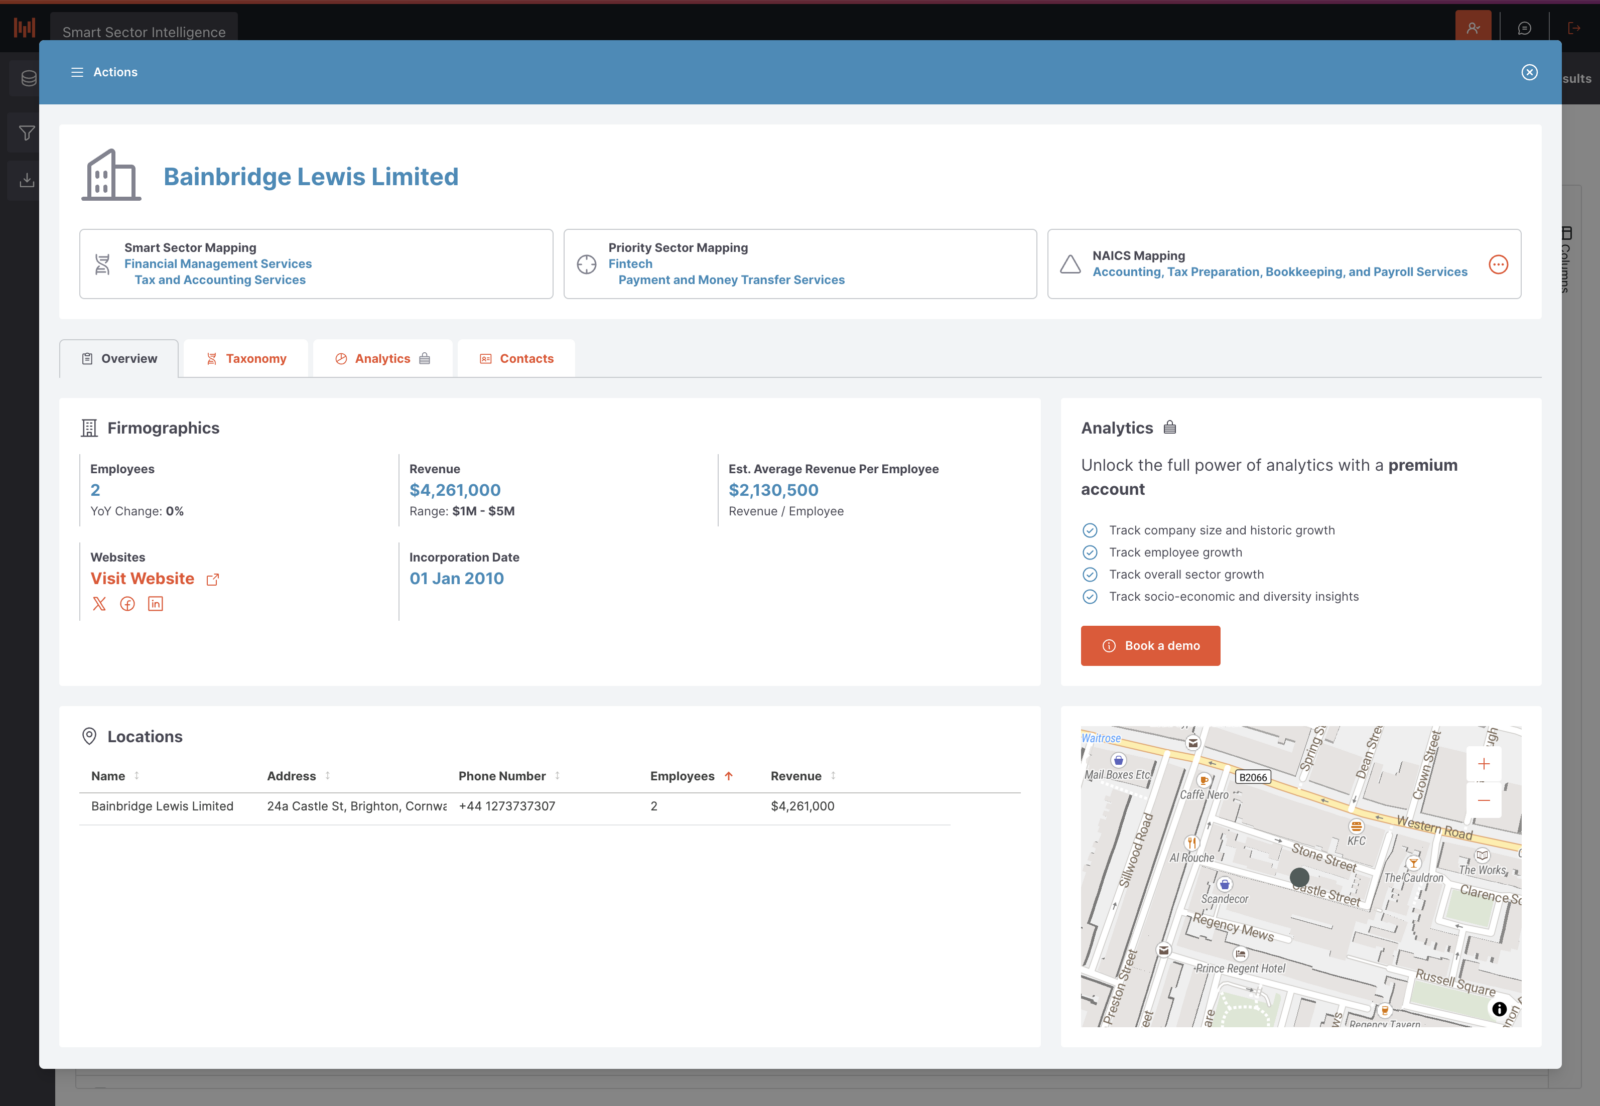
Our business profile page has had an overhaul. As our business dataset grows, we found a single page overlay was not suitable, so we have introduced a tabbed navigation here, so we can split the content into natural sections.
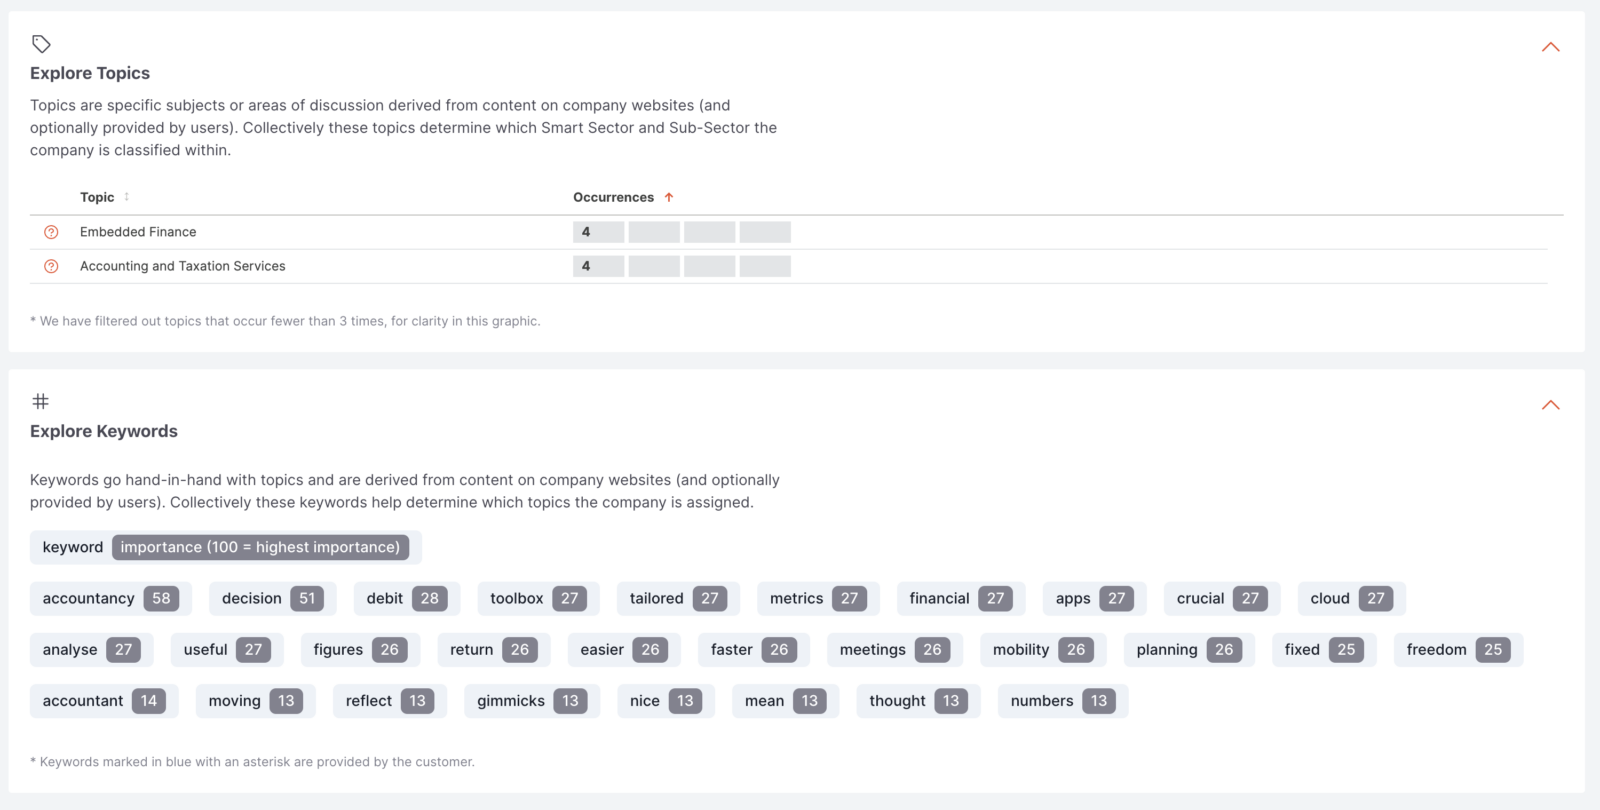
As part of our Smart Sector analysis clients can provide us with topics and keywords to define a sector. For transparency, besides showing topics, we now also show your keywords as well as ours on each business page. This can help you quickly validate why a business has been classified within that smart sector, and identify any potential misclassifications quicker.
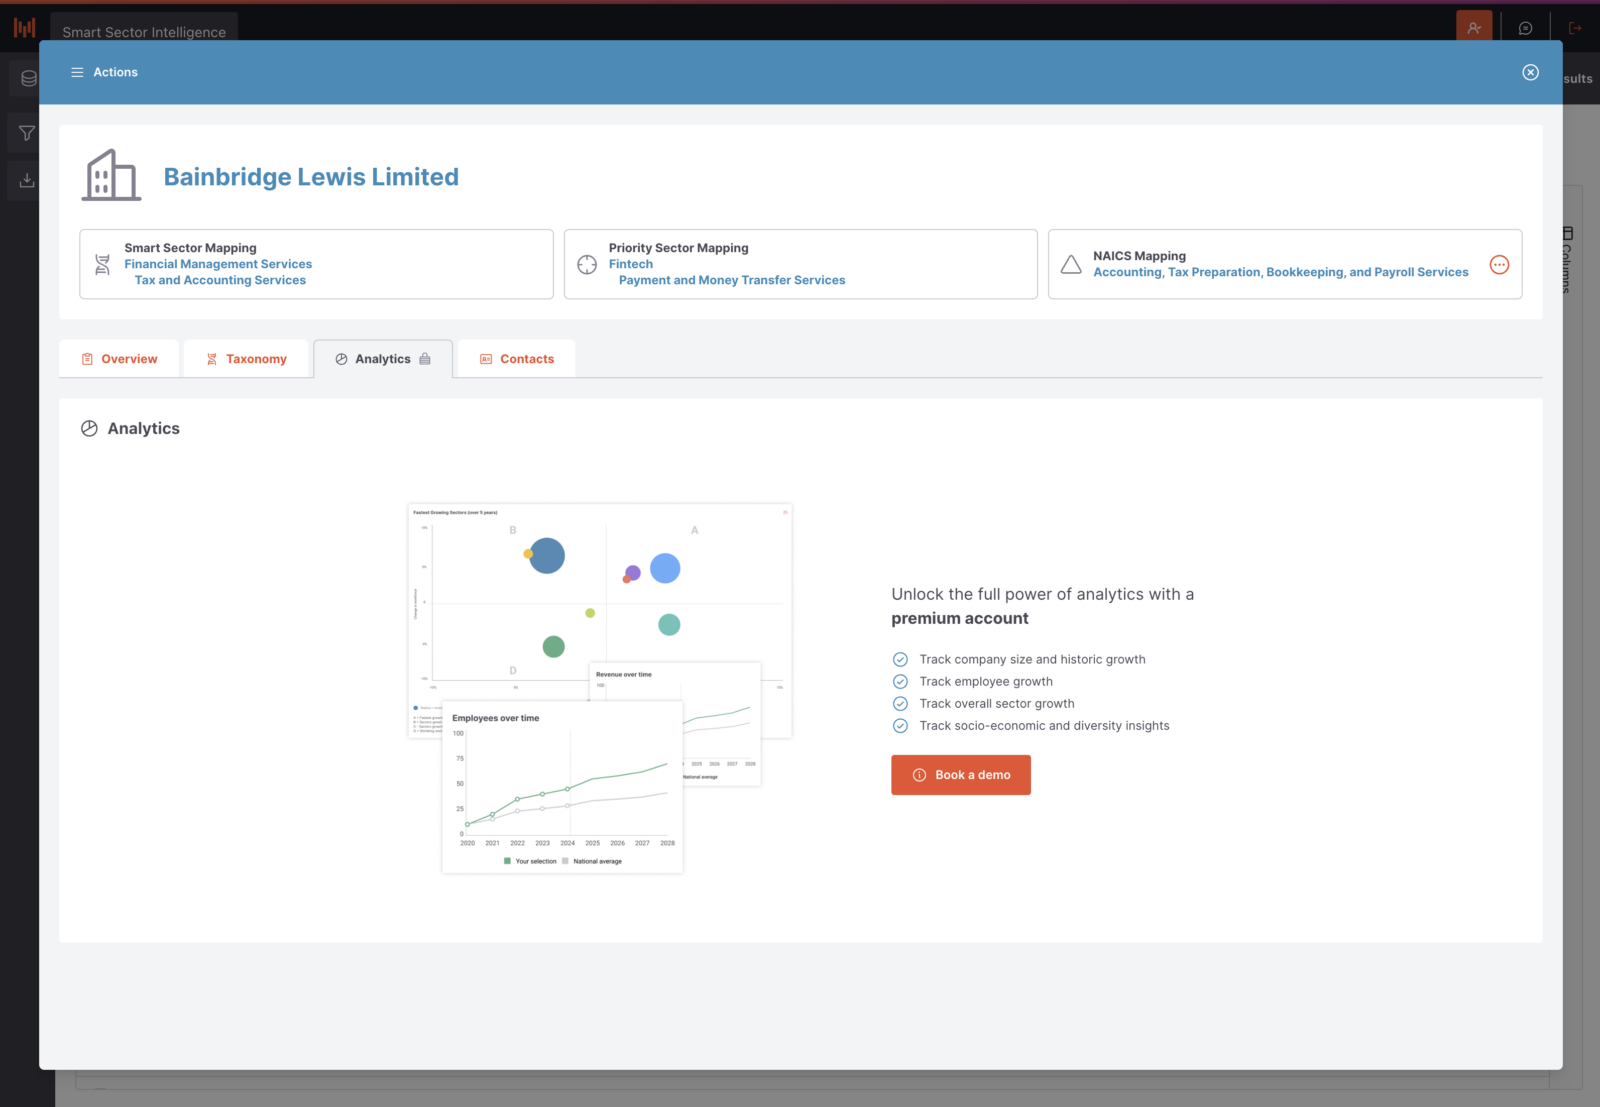
We have a set of premium analytics visualisations based on historical data and analysis, which you can speak to us about enabling on your account.
Filters
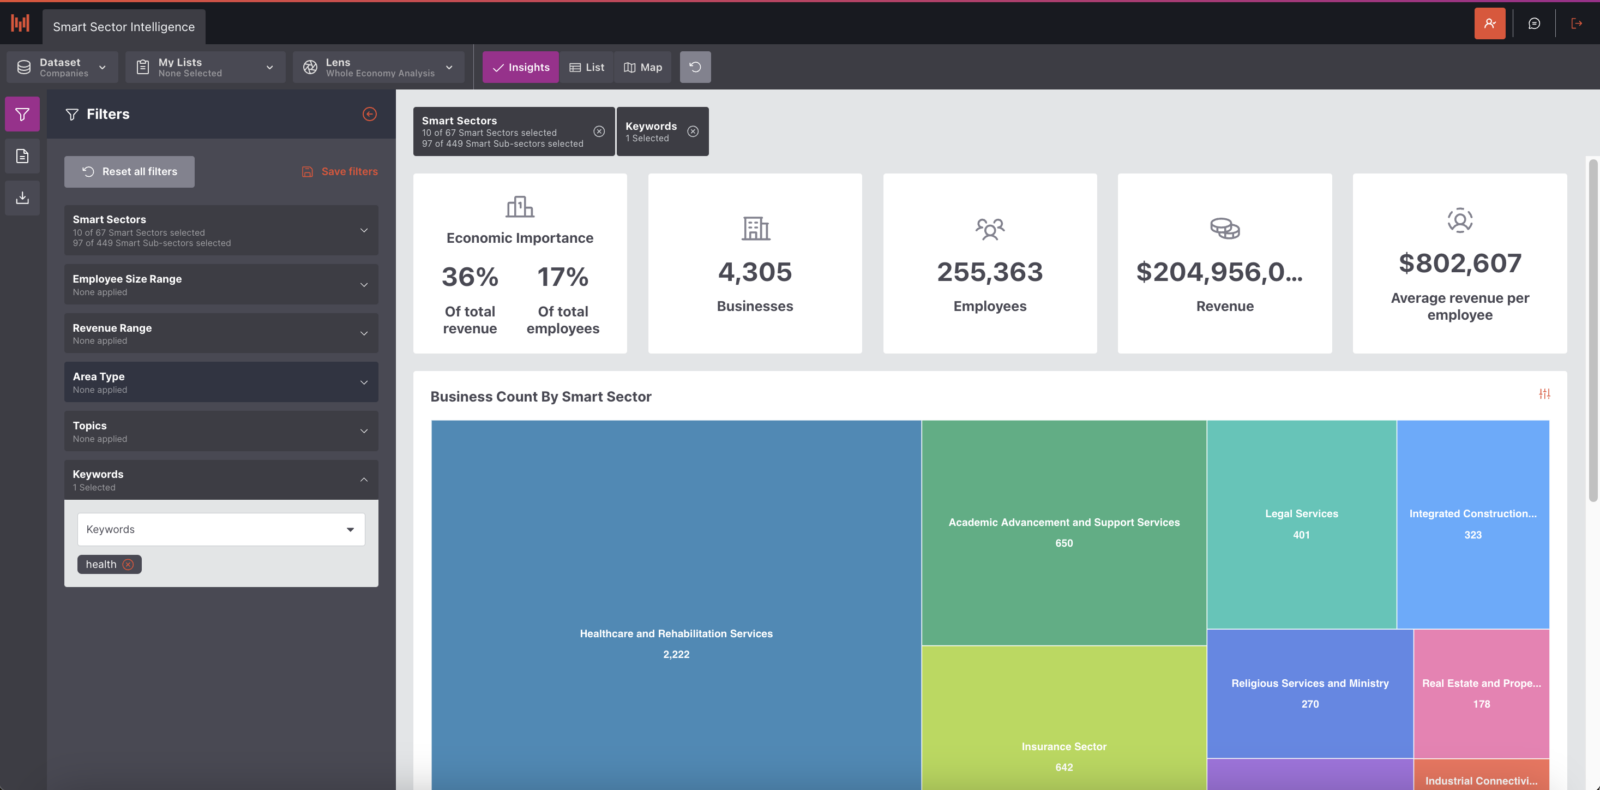
We want you to be able to focus your analysis on what matters, so we have introduced two new filter options; Topics and Keywords. This means you can narrow your analysis to specific topics and keywords of interest.
The text search for both of these effectively searches for those topics or keywords in our system, so that you can then see the businesses we have tagged and associated with either.
Our filter chain breadcrumb means you can also now see what filters are in use at the top of the page, helping you to understand the data you’re looking at. You can also quickly remove these by clicking the cross icon—convenient! You can still add and change filters from the side panel (which is now at the left instead of the right hand side.
Historical Insights
We have implemented a historical data section on our NAICS code lens (to begin with). This data gives you valuable insights into the history of a sector, allowing you to track businesses, revenue and number of employees over time.

General UI improvements
Our optimised interface is designed to save you time, allowing you to focus on what truly matters—strategic decision-making and business growth. We have re-designed the key statistics to make them easier to digest, and moved the filter bar and print summary to the left-hand navigation for a more intuitive and seamless interaction with the platform.
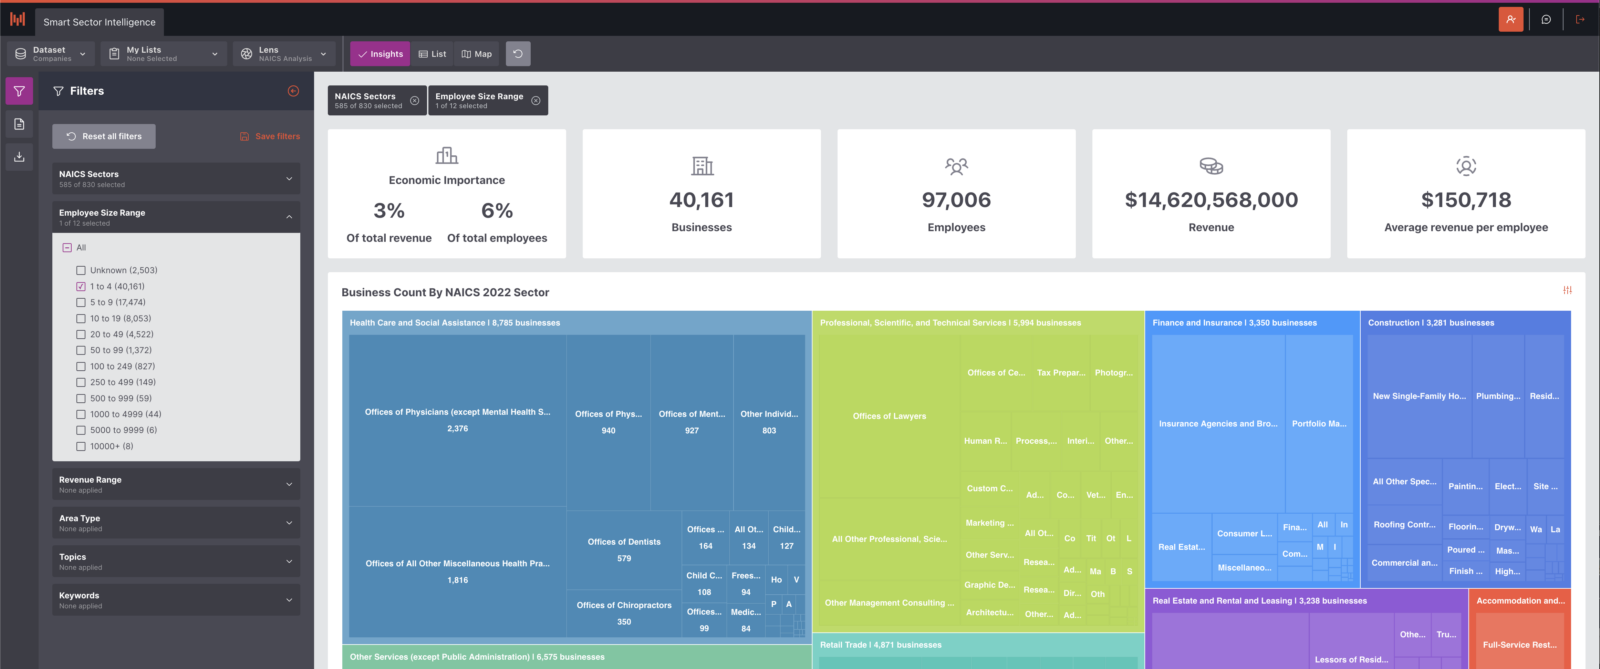
Clear navigation and quick short cuts are key to helping you get the information you need in the quickest time possible. We have added clickthrough options on the tree map so when clicking on a smart sector, you will have the option to view the sector, view a list of businesses’, or view businesses on the map.

What’s coming next?
We are always working towards new features and improvements. Here’s what we have highlighted for the coming weeks and months. (as with everything this is, of course, subject to change).
- Historic sector data for smart sectors
- Histogram chart showing the distribution of employee and revenue range
- Filter by an individual topic or keyword from the business page
- Data visual toggle on the tree map allowing you to see data presented in a sunburst chart
We look forward to updating you on more new features and improvements in the future.
